Streamlit: Simplifying Data Visualization and Exploration with Python
Streamlit is an open-source Python library that simplifies the creation and sharing of beautiful, custom web apps for machine learning and data science purposes.
With Streamlit, you can easily incorporate UI components to visualize data in your web app without the need for HTML or web stack knowledge. It provides Python APIs that serve as equivalents to web components, eliminating the need to concern yourself with the visualization aspect. Instead, you can focus solely on the data and its analysis, making the development process much more straightforward and efficient.
Streamlit Community Cloud
In addition to the Python library, Streamlit offers a community cloud to host Streamlit applications. This platform enables users to deploy their Streamlit apps with just a few clicks, making it convenient and hassle-free to share their creations with others
Toll Plaza Information App
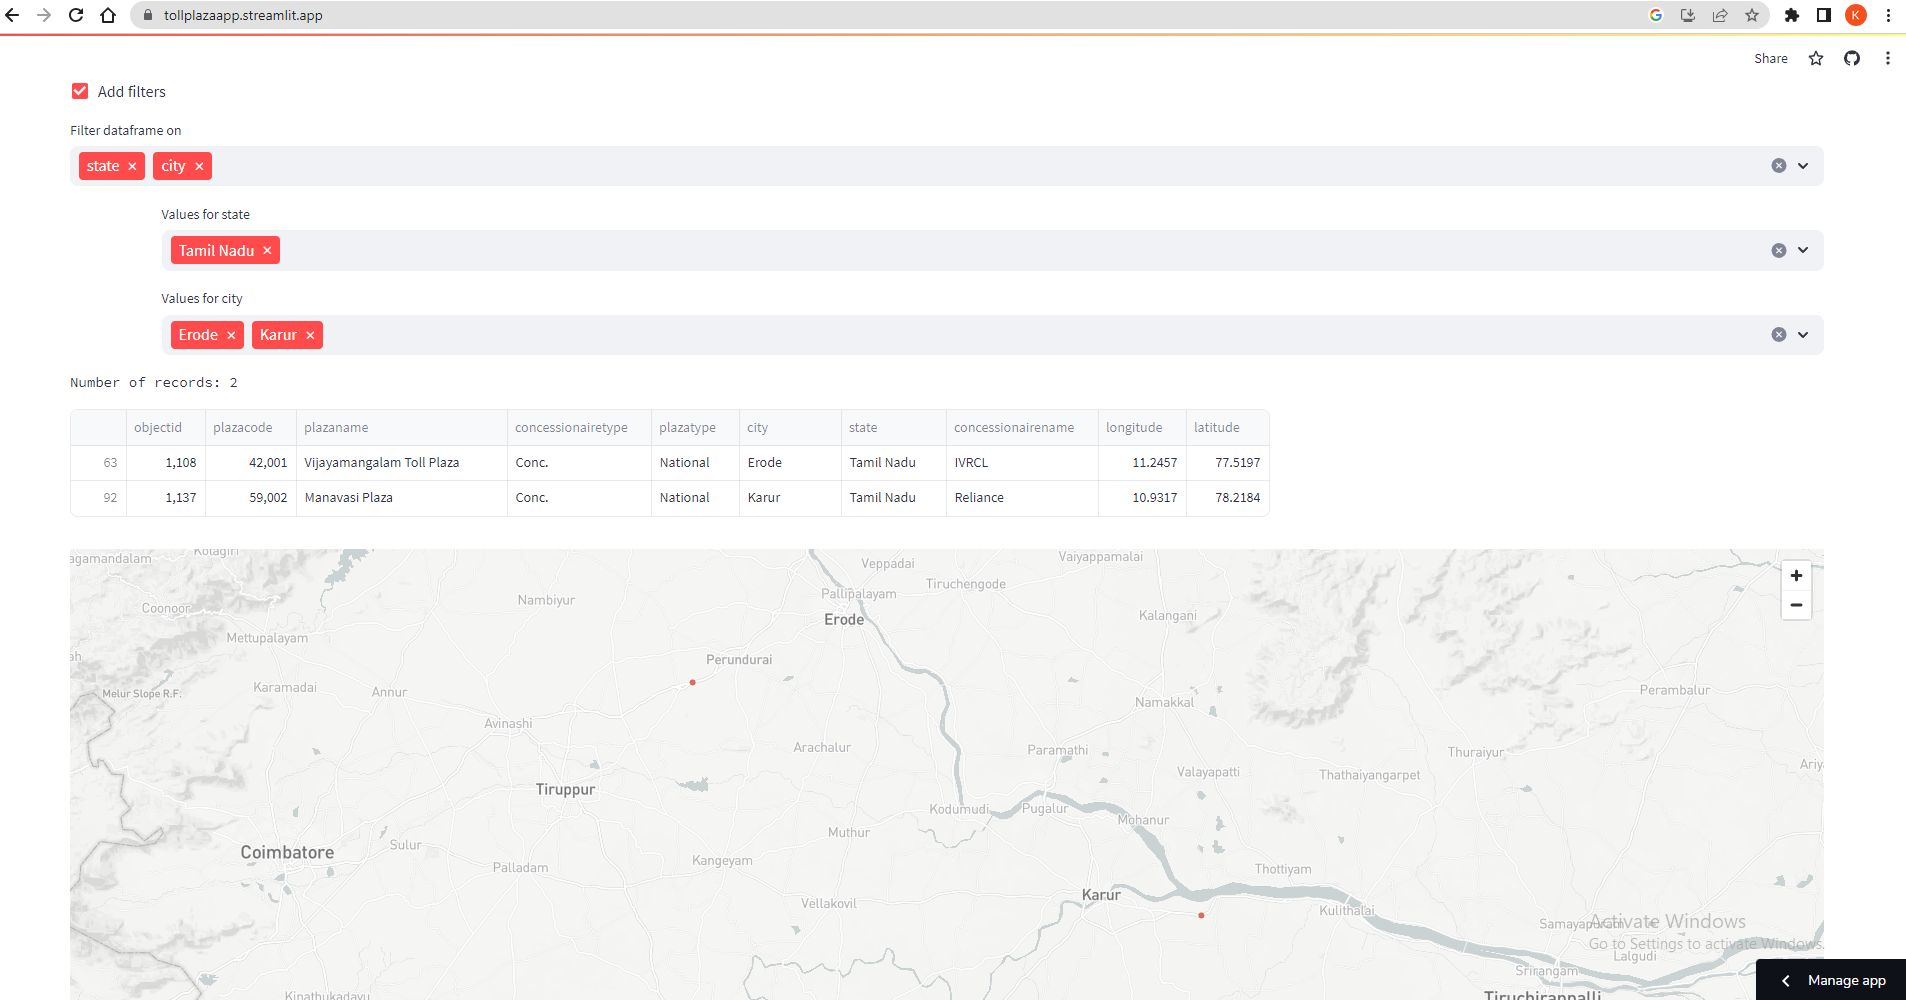
To explore the features of Streamlit and its community cloud, I have built a sample application that visualizes information about toll plazas available in India.
I was able to develop this application within a few minutes, thanks to the ease of Streamlit’s development process. The Streamlit community-hosted Toll Plaza app can be accessed at https://tollplazaapp.streamlit.app. Feel free to check it out!

Source code
from pandas.api.types import (
    is_categorical_dtype,
    is_datetime64_any_dtype,
    is_numeric_dtype,
    is_object_dtype,
)
import streamlit as st
import pandas as pd
st.set_page_config(layout="wide")
st.title('Toll Information')
def filter_dataframe(df: pd.DataFrame) -> pd.DataFrame:
    """
    Adds a UI on top of a dataframe to let viewers filter columns
    Args:
        df (pd.DataFrame): Original dataframe
    Returns:
        pd.DataFrame: Filtered dataframe
    """
    modify = st.checkbox("Add filters")
    if not modify:
        return df
    df = df.copy()
    # Try to convert datetimes into a standard format (datetime, no timezone)
    for col in df.columns:
        if is_object_dtype(df[col]):
            try:
                df[col] = pd.to_datetime(df[col])
            except Exception:
                pass
        if is_datetime64_any_dtype(df[col]):
            df[col] = df[col].dt.tz_localize(None)
    modification_container = st.container()
    with modification_container:
        to_filter_columns = st.multiselect("Filter dataframe on", df.columns)
        for column in to_filter_columns:
            left, right = st.columns((1, 20))
            # Treat columns with < 10 unique values as categorical
            if is_categorical_dtype(df[column]) or df[column].nunique() < 50:
                user_cat_input = right.multiselect(
                    f"Values for {column}",
                    df[column].unique(),
                    default=list(df[column].unique()),
                )
                df = df[df[column].isin(user_cat_input)]
            elif is_numeric_dtype(df[column]):
                _min = float(df[column].min())
                _max = float(df[column].max())
                step = (_max - _min) / 100
                user_num_input = right.slider(
                    f"Values for {column}",
                    min_value=_min,
                    max_value=_max,
                    value=(_min, _max),
                    step=step,
                )
                df = df[df[column].between(*user_num_input)]
            elif is_datetime64_any_dtype(df[column]):
                user_date_input = right.date_input(
                    f"Values for {column}",
                    value=(
                        df[column].min(),
                        df[column].max(),
                    ),
                )
                if len(user_date_input) == 2:
                    user_date_input = tuple(map(pd.to_datetime, user_date_input))
                    start_date, end_date = user_date_input
                    df = df.loc[df[column].between(start_date, end_date)]
            else:
                user_text_input = right.text_input(
                    f"Substring or regex in {column}",
                )
                if user_text_input:
                    df = df[df[column].astype(str).str.contains(user_text_input)]
    return df
df = pd.read_csv("India_Toll_Plaza_2022.csv")
fdf=filter_dataframe(df)
st.text('Number of records: '+str(fdf['objectid'].count()))
st.dataframe(fdf,width=1200)
st.map(fdf,
    latitude='longitude',
    longitude='latitude')
The above source code loads the toll information from a CSV file as a pandas data frame and displays the data frame on the web page, complete with a visually appealing and user-friendly generic filter.
The ‘filter_dataframe’ method dynamically adds filter components to the UI based on the selected columns’ data types. This allows the user to filter the pandas data frame based on their chosen filter values. The Streamlit map component plots the data frames on a map by utilizing the latitude and longitude columns from the data frame. This enables an interactive visualization of the toll plaza data geographically.
Run the code in local system
- Install Streamlit library
pip install streamlit
- Create a file named “streamlit_app.py” and paste the provided source code into it
- To begin the Streamlit application, simply run the command that executes the “streamlit_app.py” file.
python -m streamlit run streamlit_app.py
It exposes the web application at http://localhost:8501/.
Deploy the app in Streamlit community cloud
- Push the code and CSV file to a Git repository.
- Sign up on https://streamlit.io/cloud using your Google account or Github.
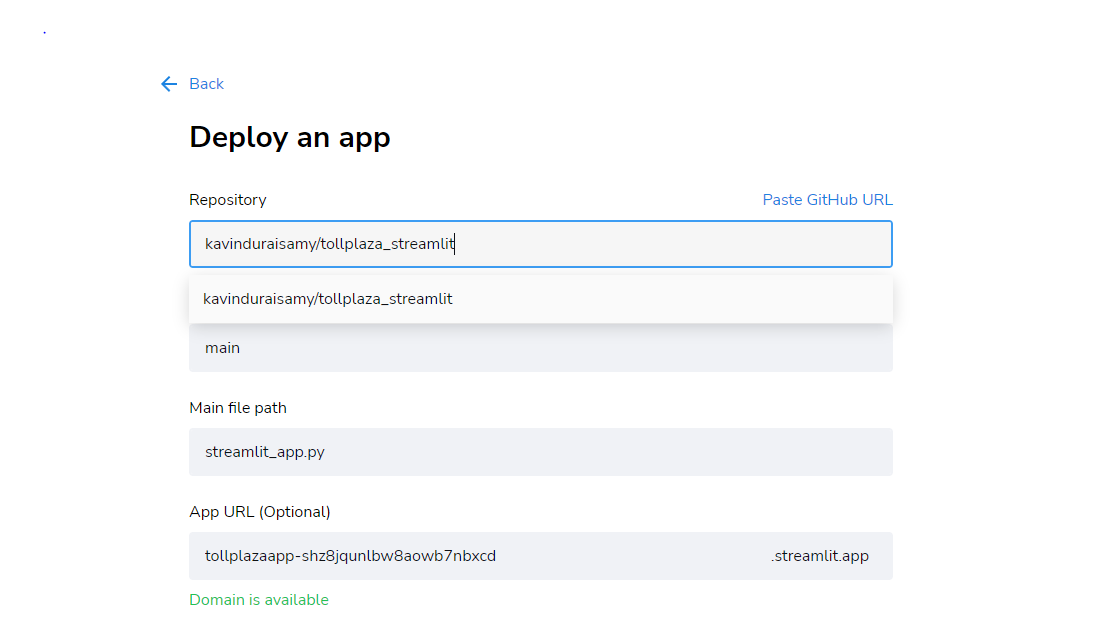
- Create a new app and provide the Git information. Then, click ‘Deploy’ to initiate the deployment process.

Conclusion
The Streamlit library significantly simplifies data visualization tasks, especially when combined with existing Python data analytics libraries like pandas. Additionally, Streamlit offers useful features such as data cache and connectors for loading data from AWS S3 and SQL databases.
I believe that Streamlit’s capabilities can be further amplified when integrated with other data analytics platforms like AWS Athena. I’m excited to explore this possibility and will share the results once I’ve completed the experimentation.
References
- Streamlit Cheatsheet: https://docs.streamlit.io/library/cheatsheet
- Streamlit Filter Data Frame Blog Post: https://blog.streamlit.io/auto-generate-a-dataframe-filtering-ui-in-streamlit-with-filter_dataframe/
- India Toll Plaza Dataset: https://livingatlas-dcdev.opendata.arcgis.com/datasets/esriindia1::india-toll-plaza-2022/explore
- Github repo: https://github.com/kavinduraisamy/tollplaza_streamlit