How to Plot Latitude and Longitude Values on a Map Image
Normally, latitude and longitude values are used to specify locations on Earth. These values are denoted in degrees and represent the angle of a location from the Equator and Prime Meridian. However, web mapping services, such as OpenStreetMap, Google Maps, and HERE Maps, are based on 2-dimensional images using the Web Mercator Projection. This means that the entire Earth is displayed as a 2D image, and 2D images are represented using X and Y axis pixels.
To illustrate this further, let’s consider a world map image with a size of 256 * 256 pixels. In this image, we want to place a marker on top of India. To achieve this, we need to find the pixel position of India within this 2D image. This is a fundamental requirement for all mapping services. In this blog, we will explore how web mapping services handle this process.
Translation of geographical coordinates to pixel coordinate
To place the marker on top of India, we must first translate the given latitude and longitude values into X and Y pixel coordinates. This translation process can be accomplished using the Mercator projection formula.
The Mercator projection formula converts geographical coordinates (latitude and longitude) into X and Y values within the range of 0 to 1. Once this conversion is done, the X and Y values can be scaled up or multiplied by the image size to match the dimensions of our image. This way, we can accurately position the marker on the 2D image representing the map.
Geographical coordinates of India
The geographical coordinates of India are Latitude 20.5937 and Longitude 78.9629.
Converting to Mercator Values
The following Python implementation will calculate the Mercator values for the given geographical coordinates.
import math

def get_mercator_value(lat, lon):
    x = (lon + 180) / 360
    sin_latitude = math.sin(lat * math.pi / 180)
    y = 0.5 - math.log((1 + sin_latitude) / (1 - sin_latitude)) / (4 * math.pi)
    print(x, y)

# Find the Mercator value to India
get_mercator_value(20.5937, 78.9629)
The Mercator values are: 0.7193413888888889 (Latitude) and 0.44152224347681013 (Longitude).
Scaling the Mercator Values to Match the Image Size
The Mercator values typically range from 0 to 1. In order to utilize these values, we must scale them up by multiplying them with the image size. For this example, we have taken the world map image size as 256 * 256. Therefore, we will enlarge these values by multiplying them with the image size of 256.
x = 0.7193413888888889
y = 0.44152224347681013

x_result = round(x * 256)
y_result = round(y * 256)

print(x_result, y_result)
The enlarged pixel coordinates are: X = 184 and Y = 113.
Placing a Marker on the Calculated Pixel Position
pip install pillow
from PIL import Image, ImageDraw
from IPython.display import display
def place_marker(image_path, x, y, marker_size=50, marker_color=(255, 0, 0)):
# Open the image
image = Image.open(image_path)
# Create a drawing context
draw = ImageDraw.Draw(image)
# Calculate marker coordinates
x1 = x - marker_size // 2
y1 = y - marker_size // 2
x2 = x1 + marker_size
y2 = y1 + marker_size
# Draw a rectangle as the marker
draw.rectangle([x1, y1, x2, y2], outline=marker_color)
# Display the modified image
display(image)
# Replace 'path_to_image.jpg' with the actual path of your image
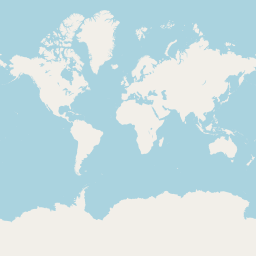
image_path = "world_map.png"
# Replace 'x' and 'y' with the pixel coordinates
x_position = 184
y_position = 113
# You can customize the marker size and color if needed
marker_size = 20
marker_color = (255, 0, 0) # Green color
# Call the function to place the marker
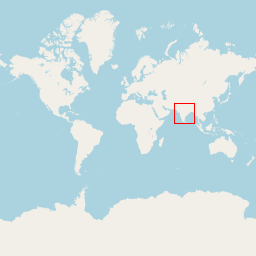
place_marker(image_path, x_position, y_position, marker_size, marker_color)
Input
Output